Operational reporting for SOC #
Exec summary
This blog post addresses the challenges of effective stakeholder reporting in Security Operations Centers (SOCs). It emphasizes the importance of clear and concise communication to different audiences, including management, risk teams, and technical staff. The post advocates for automating and standardizing reporting processes using tools like Fabric Templates, which streamline the creation of comprehensive SOC activity reports. Key metrics such as SLAs, false positive/true positive ratios, and estate coverage are discussed, highlighting their role in assessing SOC performance. The goal is to improve SOC efficiency, enhance stakeholder understanding, and reduce operational burdens through better reporting practices.
Introduction #

Effective stakeholder communications are a common challenge within Security Operations Centers (SOCs). The SOC must be kept in sync with other critical teams in the organization, such as risk, IT, legal, compliance, and executive management. Business decision-makers need to understand the value of the SOC, its operations, and its goals, and if they don’t, regulatory constraints like NIS2 and DORA (coming to the EU this year!) will force them to take notice.
What #
SOC stakeholders need clear, concise information that helps them understand both the big picture and the technical details.
Management is interested in the overall impact of SOC activities on business risk and security, key performance indicators (KPIs), and any major incidents. The risk teams might need metrics to calculate risk — detection capabilities, false positives/true positives, rule performance, and analytical load. The technical teams are interested in the technical details and indicators of compromise. Keeping everyone up to date ensures they have the necessary data to make informed decisions and act.
In this post, we focus on methodologies for measuring SOC performance through operational metrics. We’re going to build a Fabric template for a “SOC weekly activity overview” report. To be able to follow the code examples, learn core concepts of Fabric Configuration Language in the Tutorial.
How #
The best way is to write it down – as a report, an email, a briefing, an overview, or similar. These artifacts can be shared with the stakeholders asynchronously, kept for bookkeeping (for audit and compliance), used for meta-analysis, and used as a reference. While dashboards might be visually appealing and colorful, they often fail to convey a coherent message and are difficult for non-practitioners to understand (they don’t look at them daily!).
Effective communication also requires tailoring content for diverse audiences. Utilizing tools like Fabric can help standardize and simplify the reporting process, making it easier to deliver relevant information to all stakeholders.
How do we create reports that are informative but not overwhelming? This requires understanding the needs of stakeholders and consistent practice. To support practitioners, we’ve created the Fabric Templates repository, where we collect free-to-use templates for various cybersecurity use cases, including operations, CTI, pentesting, compliance, and more.
Who #
It’s necessary to ask: who should report on SOC metrics?
Ideally, this would be the CISO or SOC manager, but in reality, it varies. This responsibility could fall to the governance/risk team, SecOps team (which probably owns the data), data or security engineers, or even individual SOC analysts. Cybersecurity requires practitioners to have generalist skills at every level, and they might be expected to handle on top of their other responsibilities. The ability to communicate operational challenges and quantify embedded risk through reporting is undoubtedly a useful skill for every security practitioner, regardless of specialization or seniority.
Metrics and why security practitioners hate them #

Typical SOC dashboard
If you were to get electrocuted every time you looked at a graph, you’d probably start to dislike graphs. Many security practitioners feel the same way about metrics and key performance indicators (KPIs). Businesses often define these inappropriately, incentivizing undesired outcomes and causing disengagement and high turnover rates in security staff. This is one of the factors driving the high burnout rates in cybersecurity.
“Bad” KPIs #
A commonly used KPI, especially at managed security service providers (MSSPs), is Mean Time to Respond (MTTR). Regardless of how this is defined, if it’s associated with performance of the analysts and rewards lower values, it will encourage unwanted behaviors.
If we define “response” action as acknowledging an alert, we incentivize responding to alerts as quickly as possible. Obvious, right?
As a result, an analyst will have many alerts open at any given point, mixing contexts, degrading focus, and reducing overall efficiency. This is horrendous because it poisons other metrics and clouds the true performance indicators of the SOC. Adding a supplementary metric measuring how long an alert spends in each state (e.g., acknowledged, triaged, handed off to another team) might help, but now we’re band-aiding the problem we created ourselves.
High-performers will find this tedious and pointless. It will burn them out, as they will feel compelled to deliver these futile results in the name of “business performance”.
For MTTR to be effective as a measure of analyst performance, the value shouldn’t be visible to analysts, and the incentive shouldn’t be to minimize it. Instead, it should detect performance outliers — analysts performing significantly below or above the standard baseline — and prompt investigation into the cause. The outliers could indicate a problem with the processes or point to a better way of doing things that aren’t yet standard practice.
“Good” KPIs #
A good KPI considers the context in which it operates and the behaviors it incentivizes, particularly at the extremes. It also clearly specifies the breaking point at which it stops being effective, as over-optimization can lead to negative consequences and overall bad time.
The “bad” KPI described above could be better, but not when it measures the performance of the analysts. For example, if MTTR is applied to an engineering team responsible for the tooling supporting analysis processes (a more appropriate context for the metric), it will incentivize process streamlining. This can also be taken too far, becoming counterproductive: the engineers might start serving 0 alerts to analysts for that sweet MTTR of 0 seconds.
The ideal KPI remains beneficial even under significant efforts to over-optimize performance to meet it.
The KPIs should be implemented in a way that minimizes opportunities to game them: the metrics should be calculated automatically, using a transparent algorithm, from a defined set of inputs. The impartiality and transparency of the process reduce the space for disagreement and conflict.
Another example of a “good” KPI is an estate coverage metric. When well-defined and integrated with the asset registry, it has a clear ceiling (up to 100%) and is easy to understand. It’s simple but powerful—it outlines the boundaries of the SOC’s field of view. We will dive deeper into the estate coverage metric a bit later in the post.
In addition, it’s important to remember that any metric should be analyzed in the context of the other metrics, team dynamics, stakeholder relationships, and the broader business environment.
The case for automation and standardization #
In a busy SOC, efficiency and accuracy are crucial. Manually consolidating data from various security solutions is time-consuming and error-prone, introducing noise to the signal. Often considered part of the “cybersecurity practice” and accepted as an unavoidable operational workload, it leads to inconsistent practice — the messaging becomes confusing, in-house reporting guidelines aren’t enforced, and the lines of communication break down. Stakeholders aren’t updated, threat response time increases, and everybody has a bad time.
Interestingly, a practice adjacent to cybersecurity — infrastructure management — already solved a problem with similarly dull, fragile, and process-heavy manual work: it evolved from custom ad-hoc scripts to a scalable infra-as-code approach. CI/CD for infrastructure became a thing, enforcing quality controls and improving transparency. This shift to infra-as-code elevated the discussions in the teams from the implementation details to redundancy, compliance, and budget planning. By automating infrastructure management and establishing clear KPIs, DevOps teams made themselves happier and more effective. The right tech stack enabled this evolution.
With Fabric, we aim to cause a similar shift in cybersecurity reporting. The reporting-as-code approach lets cybersecurity practitioners use proven DevOps practices to automate, standardize, and quality-control their reporting. With standardized and codified stakeholder communications, it’s easier to improve the format – it’s just another discussion in a pull request.
By using Fabric templates, version-controlled in Git, QA-ed / deployed in CI/CD, the security teams can free up time to focus on research and direct defense.
In this post, we encode operational SOC metrics in the “SOC Weekly Activity Overview” template, with the Elastic Security solution as the primary data source (note that Fabric supports other data sources, too!). For simplicity, the report screenshots in this post show a Markdown version of the report.
Let’s get to it!
Report structure #
The SOC activity overview report is a comprehensive snapshot of the SOC’s performance over a selected period (one week in our template), with every section focusing on a different aspect:
- The Executive Summary connects risks to business impacts.
- The KPIs section focuses on three vital metrics: service level agreements (SLAs), false positive/true positive rates, and estate coverage. These metrics were chosen to represent operational efficiency, detection accuracy, and SOC visibility scope.
- The Rule Performance section describes the state of detection capabilities, providing insights into the effectiveness and reliability of the SOC’s threat detection mechanisms.
- The Analytical Load section examines the team’s alert load and throughput, highlighting the workload and shift coverage over the reported period.
The activity overview report is an organization’s “security practice heartbeat” update.
Data requirements #
According to the “Oracle and KPMG Threat Report 2020” research, 92% of 750 respondents had more than 25 discrete security products in use in their organization, and 37% had more than 100. This proliferation of security tools leads to data silos, where critical information is fragmented across various systems and platforms. Writing an operational report that covers multiple facets of cybersecurity practice in such an environment is difficult and tedious. Manually consolidating data from these disparate sources not only consumes time but also increases the risk of mistakes and inconsistencies.
Even though the template we’re building uses data only from the Elastic Security, we still operate with multiple datasets and data slices. By defining the data requirements inside the Fabric template, we make data dependencies clear and rely on Fabric integrations for data querying. This reduces the risk of mistakes and allows us to guarantee coverage quality — we can apply QA checks to the data definitions, detecting gaps, confidential data access, or exposure of GDPR-protected data.
Data requirements are defined by data blocks and represent a collection of data points fetched from an external source (Elastic Security solution, specifically either Elasticsearch or Kibana) via the integration:
# Alerts created in a current period
data ref "alerts_curr" {
  base = data.elasticsearch.alerts_w_aggs

  query_string = "@timestamp:[now-7d TO now]"
  size = 30000
}

# Alerts created in a previous period
data ref "alerts_prev" {
  base = data.elasticsearch.alerts_w_aggs

  query_string = "@timestamp:[now-14d TO now-7d]"
  size = 0
}

# Alerts with impact, created in a current period.
# The alerts with impact are marked with "Materialised risk" tag.
data ref "alerts_curr_w_impact" {
  base = data.elasticsearch.alerts_w_aggs

  query_string = <<-EOT
    @timestamp:[now-7d TO now]
    AND NOT kibana.alert.workflow_status:"open"
    AND kibana.alert.workflow_tags:"Materialised risk"
  EOT
  size = 10000
}
...
The data requirements are listed inside the template and can be adjusted with the environment variables. The data blocks are powered by elasticsearch data source (part of elastic plugin) and rely on a reusable data.elasticsearch.alerts_w_aggs data block (defined outside the template) with helpful aggregations. See the documentation for the data blocks and the template code for more details.
Executive summary #
An executive summary should always serve the purpose of a “tl:dr”. The information here should be the key output of the team creating a report and must be easily understandable by a non-expert.
Check out an example at the beginning of this post! LLM wrote it!
A helpful approach during formulation is to imagine a key stakeholder of the function in an elevator asking you, “What happened and why should I care?” just as you enter the elevator and the doors close. The key stakeholders might differ in different organizations. If the key stakeholder is the CISO, they will likely want to know about incidents that may impact the company and the scope of the impact on the business.
The content that follows must answer any questions that may arise and provide enough details to enable stakeholders to act. If more context is needed, dedicated complementary materials (like an incident response summary, or a list of IOCs) should be disseminated with the report.
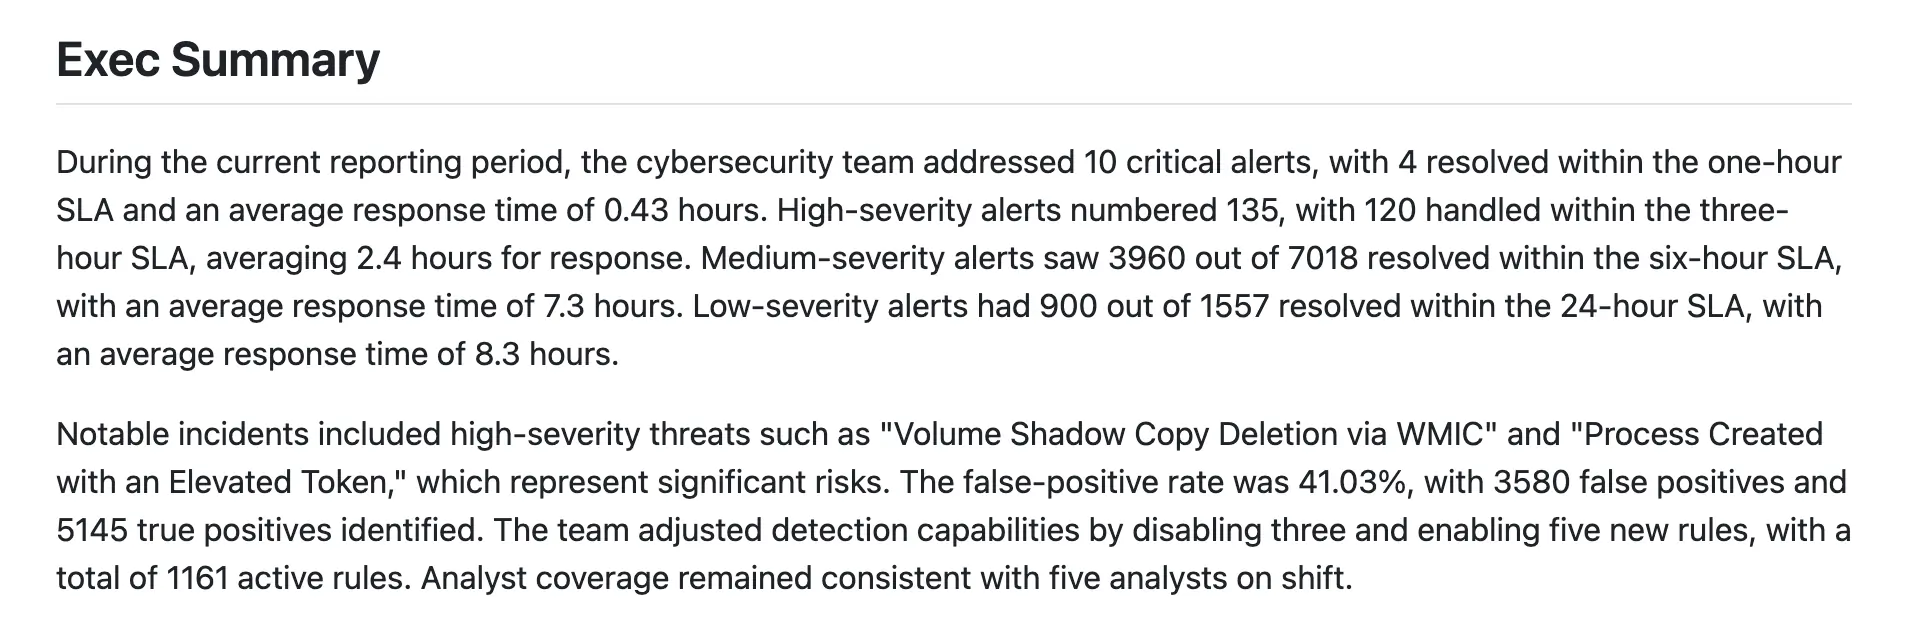
For this block, we can use GenAI summarisation capabilities — the scope is limited, the ML models excel at summarisation, and the content is very dynamic (it depends highly on input data that shapes the report). We’ll use openai_text content provider from openai plugin:
content openai_text {
  local_var = query_jq(
    join("\n", [
      from_file("./utils.jq"),
      <<-EOT
        gather_data_for_summarisation(
          .data.elasticsearch.alerts_curr_w_impact.hits.hits;
          .vars.alert_slas_hours_per_severity;
          .data.elasticsearch.alerts_curr.hits.hits;
          # ...
          # and other data points for LLM to summarise
        )
      EOT
    ])
  )
  model = "gpt-4o"
  prompt = <<-EOT
    As a security analyst, write an executive summary of the operational metrics for SOC for the
    current reporting period. The metrics are listed below. In the summary, prioritise metrics that
    are important for the business: the ones that increase risk and affect operational continuity.
    Do not give advice, only summarise. If there is no data, say nothing.
    Be concise and limit text to two paragraphs. Output plain text without any Markdown formatting.
    {{ .vars.local | toJson }}
  EOT
}
The prompt can be tuned to fit our needs. It fully defines the data exposed to LLM, together with the system prompt set in the content provider configuration, so we have total control over what OpenAI API receives. The data is prepared in the gather_data_for_summarisation JQ function, stored in local variable and added to the prompt as serialized JSON. See the documentation for openai_text content provider for more details.
Materialized risk #
Our template refers to the impact on the business as materialized risk. For example, an incident not prevented in time that forced remedial action is an incident with materialized risk.
A more technical example: there is always a risk that somebody will break in into the exposed SSH server by brute-forcing the access credentials. The day someone succeeds and breaks through, there is no longer just a risk — there is a problem with the potential to impact the business materially (as in affecting the wallet). This event needs to be accounted for by the executive and risk teams tailoring the operational risk profiles of the business.
To track alerts with materialized risk, we use a custom “Materialized Risk” alert tag. See the documentation for Elastic Security on how to add custom tags to the security alerts.
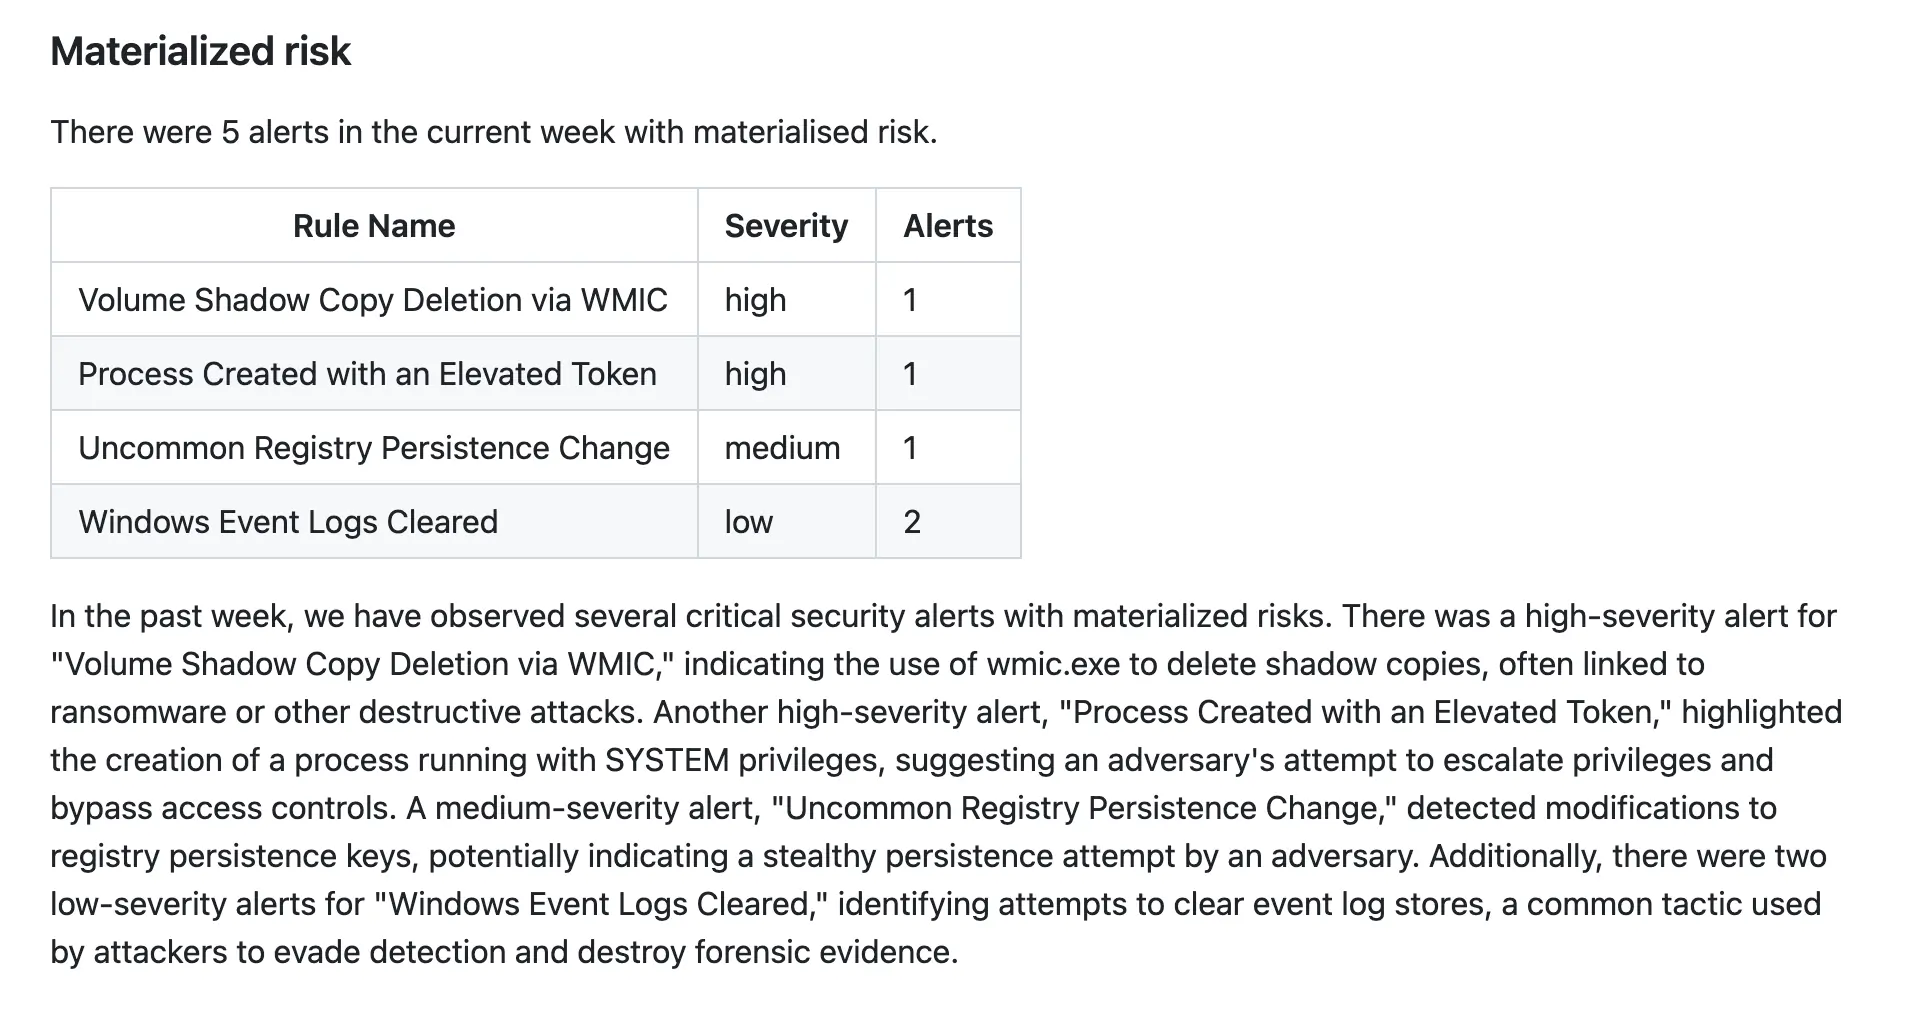
The section includes a table rendered with a table content block (in the code) and a description block. Similarly to “Exec Summary”, the description has limited scope (it’s only a summary) and can be generated by an LLM:
content openai_text {
  local_var = query_jq(
    <<-EOT
      .data.elasticsearch.alerts_curr_w_impact.hits.hits
      | map(._source)
      | map({
          "description": ."kibana.alert.rule.description",
          "name": ."kibana.alert.rule.name",
          "severity": ."kibana.alert.rule.parameters".severity,
      })
    EOT
  )
  model = "gpt-4o"
  prompt = <<-EOT
    Describe the alerts with materialized risks seen in the last week using the data
    provided in the prompt. Do not provide advice, just summarise the details of the alerts.
    Be concise and limit the description to a single paragraph.

    {{ .vars.local | toJson }}
  EOT
}
Note the data preparation step in the JQ query string: the alerts with the “Materialized Risk” tag returned from Elasticsearch are used to create a list of dictionaries that contain only the rule name, rule description, and the severity of the rule. The data is serialized to JSON, included in the prompt, and sent to OpenAI API for summarisation.
Operational KPIs #
We’ve selected 3 metrics for operational KPIs: SLAs, False Positive / True Positive ratio, and estate coverage.
SLAs #
As previously mentioned, SLAs without context can incentivize counterproductive behaviors. That’s why the table we use in the template contains the acceptable limits for the business’s risk appetite (as thresholds in SLA hours) and the ratios of the SLA being met, along with the TTR. This lets us keep tabs on how the SOC copes with its current workload.
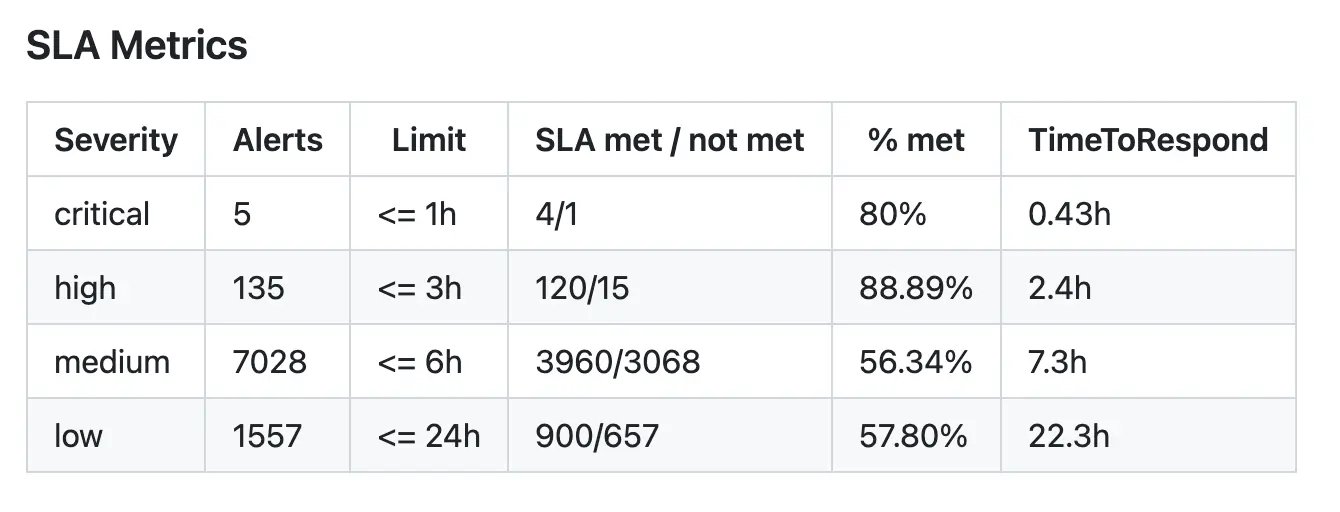
In our template the SLA thresholds are defined inside the template, but we can also fetch them from an external service or load from a local file:
# SLAs thresholds in hours per alert severity
alert_slas_hours_per_severity = {
  low = 24
  medium = 6
  high = 3
  critical = 1
}
Elastic Security doesn’t track alert status changes beyond the last update, so we rely on kibana.alert.start (alert’s creation time) and kibana.alerts.workflow_status_updated_at (alert’s last update time) fields for calculating if SLA was met. Note that this is quite error-prone, as it doesn’t account for any follow-up updates to the status, updating kibana.alerts.workflow_status_updated_at value and making the calculation incorrect.
See the full definition of the table block, together with data preparation logic, in the template code.
True / False positives #
FP/TP ratios are well-known detection metrics. They’re easy to understand and offer valuable insights: The FP/TP ratio for alerts in SOC is a useful gauge for assessing the quality of detections in the context of the alerts produced.
It’s important to note that FP % we calculate is not a classic FP rate: we’re interested in the measure of noise – the percentage of FP alerts in all alerts created in the period. Classic FP rate measures the overall performance of the detection.
Another thing to remember is that the metric has built-in biases. It represents the combined quality of the security tooling (Elastic Security here), detection content (detection rules), input data (available data sources, sensor visibility), and configuration (data retention policies, sensor configuration).

To track True and False positives, we rely on custom alert tags in Elastic Security. The documentation for Elastic Security provides details on how to add custom tags to the alerts.
This section is defined as a simple text block:
content text {
  local_var = query_jq(
    <<-EOT
      .data.elasticsearch.alerts_curr_wo_impact.aggregations.per_tag.buckets as $agg_buckets
      | {
         "true_positives_count": ([($agg_buckets[] | select(.key == "True Positive"))][0].doc_count // 0),
         "false_positives_count": ([($agg_buckets[] | select(.key == "False Positive"))][0].doc_count // 0),
        }
      | .percentage = (
        if .false_positives_count > 0 then
          ((.false_positives_count / (.true_positives_count + .false_positives_count) * 100) | floor)
        else
          0
        end)
    EOT
  )

  value = <<-EOT
    - *True Positives*: {{ default 0 .vars.local.true_positives_count }}
    - *False Positives*: {{ default 0 .vars.local.false_positives_count }}
    - *FP %*: {{ .vars.local.percentage }}%
  EOT
}
}
Note that we chose to define the calculations for the metric inside the block, next to the text template, making it easy to update and maintain. The content block can be reused in other templates, carrying the calculations and rendering logic in it.
Estate Coverage #
The estate coverage is an excellent metric with a hard limit and a clear goal. We apply it to two different entities: endpoints and detection rules.
Endpoints coverage #
Estate coverage applied to assets is a fragile metric, as its effectiveness depends on a couple of core conditions:
- the availability of the assets registry. If we don’t know how much estate there is to cover, the theoretical performance ceiling of the metric is infinite, making it less useful. It’s “an infinite warehouse” problem:

- a clear definition of what coverage means. If we can’t state what “coverage” means (maybe an agent with default config installed, or specific logs streamed into the security data lake, etc) or know how many assets we monitor, the metric loses its value.

In real life, we should assume that the organization has incomplete assets registry and that the coverage will differ from asset to asset. This assumption forces us to treat this metric as a relative indicator that shows a dynamic over time.
In the template, we calculate the endpoint estate coverage using fleet agent counts for the reporting period:
- the number of new agents enrolled in the fleet
- the number of agents that missed their check-in
While this variation of the metric no longer tracks the coverage of the total estate (infinite warehouse), it shows us whether the existing coverage is increasing or decreasing. We can easily extend the template, adding an external assets registry (or just a Google Spreadsheet) as a data source and adjusting the metric for the absolute numbers.
Our choice to calculate the metric purely from Elastic Security fleet data creates the aforementioned infinite warehouse problem but might also be the first step towards a solution — the assets seen in monitoring data can be used to populate the asset registry. As a result, we would know all unique agents seen in telemetry and note all agents that disappear, a self-defining relative baseline. Ideally, this would be a holdover metric while the business works towards a more complete asset registry.
The section is rendered using text content block with a Go template string:
section "fleet" {
  title = "Fleet agents"

  content text {
    value = <<-EOT
      {{- $r := .data.elasticsearch.fleet_agents_enrolled_curr -}}
      {{- $m := .data.elasticsearch.fleet_agents_wo_checkin_curr -}}

      *New agents enrolled in the current week*: {{ if eq $r.hits.total.relation "gte" -}} > {{- end -}}{{ $r.hits.total.value }} (previous week: {{ if eq $r.hits.total.relation "gte" -}} > {{- end -}}{{ $r.hits.total.value }})

      *Agents that missed their check-in*: {{ if eq $m.hits.total.relation "gte" -}} > {{- end -}}{{ $m.hits.total.value }}
    EOT
  }
}
Rule coverage #
We also apply the estate coverage metric to detection rules: we track which rules have been enabled or disabled in the reporting period. This allows us to track what is and isn’t covered as the SOC adjusts its capability. We focus only on the rules themselves, but the metric can be extended to calculate the change in MITRE ATT&CK coverage (if rules are labeled with techniques), the list of services monitored, attack vectors covered, or threats tracked.
The rule coverage block lists the rules enabled or disabled in the period:
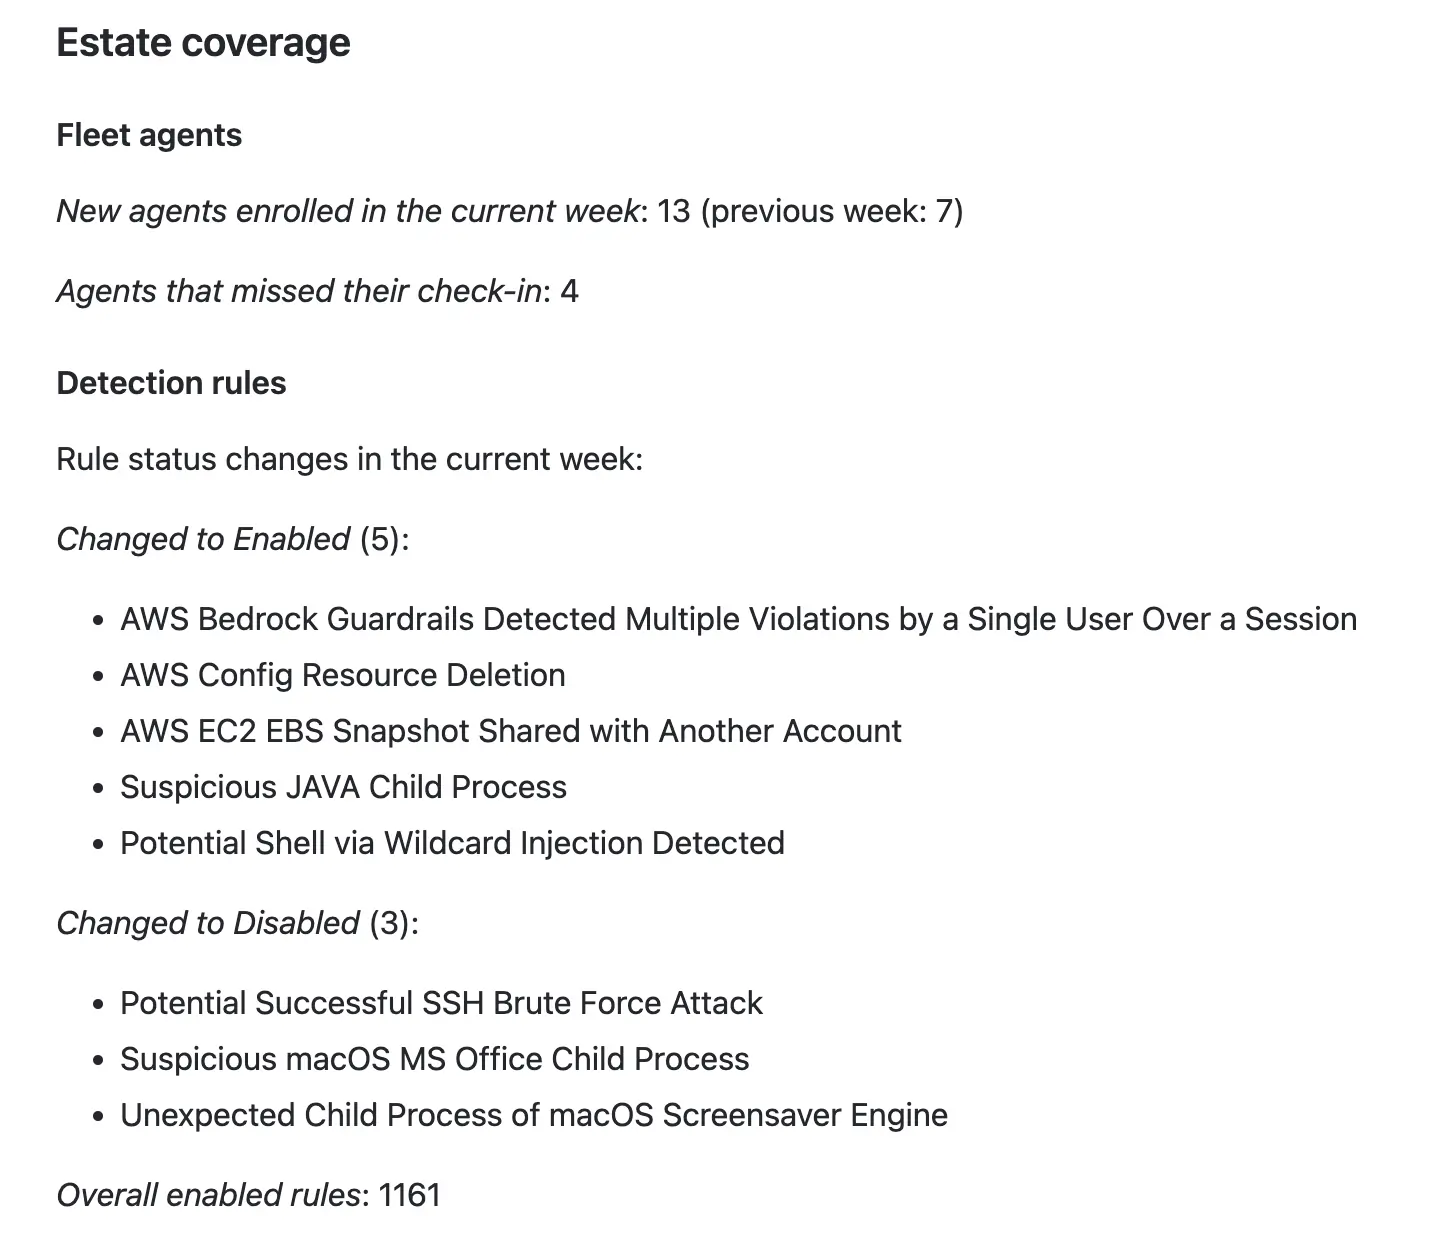
Although the rule coverage changes may not be immediately actionable, having them in the report allows us to keep the audit trail for post-incident retros or for auditors and regulators.
For the comprehensive dashboard view of the detection rule coverage, take a look at “Detection Engineering Threat Report (DETR)” from REx project.
Rule Performance #
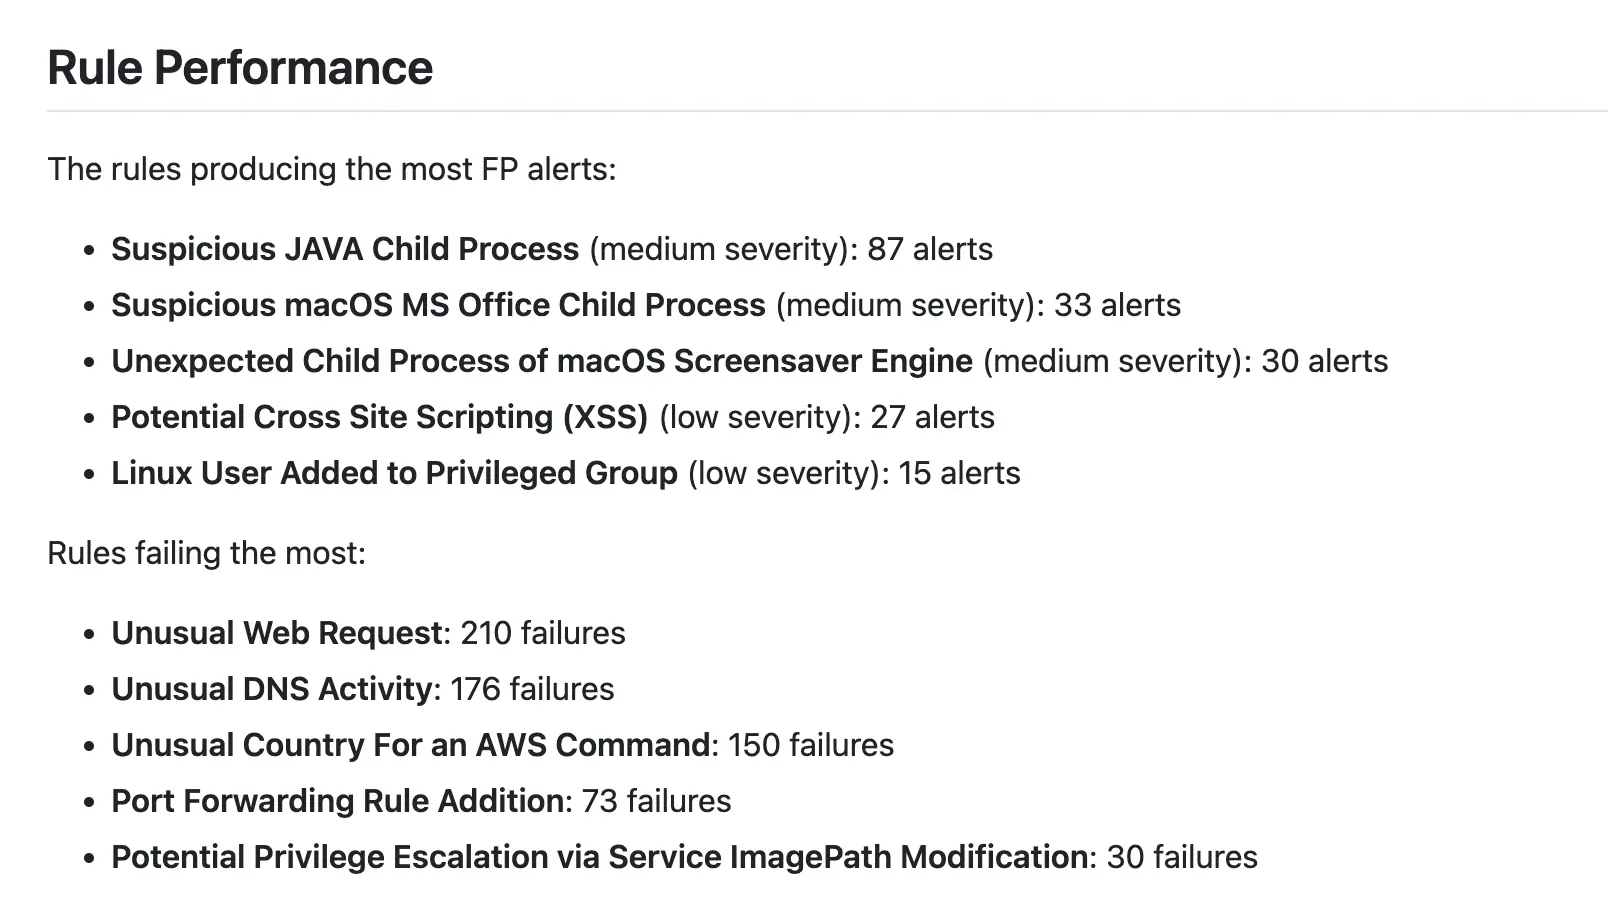
This section of the report covers the detection rule performance metrics:
- What’s creating the most operational noise (false positives)?
- What’s detecting most incidents that impact the business?
- What rules are causing analysts the most problems or don’t run effectively?
These metrics allow stakeholders within the SOC to monitor and track operational effectiveness. They can also be used as input data for a meta-analysis of the rules’ performance, helping the team to catch patterns of inefficiency.
A similar analysis applied to the most successful rules allows us to understand why they’re successful. However, it’s important to remember that factors outside the SOC may affect a rule’s performance, such as infrastructure changes, vendor on-boarding and off-boarding, software upgrades, etc. Also, see the point on biases for True / False positives section.
Stating which rules detect the most incidents is great for tracking SOC performance; however, it’s also useful in highlighting gaps in technology, policies, or business processes. For example, if our most successful rule detects successful brute-force logins, it’s a signal to enforce a stronger password policy or 2FA process.
In addition, tracking rule failure rates allows management and engineers to identify pain points with the current ruleset, gaps in data sources or misconfigurations. Frequently failing rules are likely to negatively impact other metrics and outcomes, so keeping track of these is important to ensure alerts aren’t being missed.
Analytical load #
This section of the report showcases the workload for staff, contributing to the context for understanding the top-line metrics as one complete story.
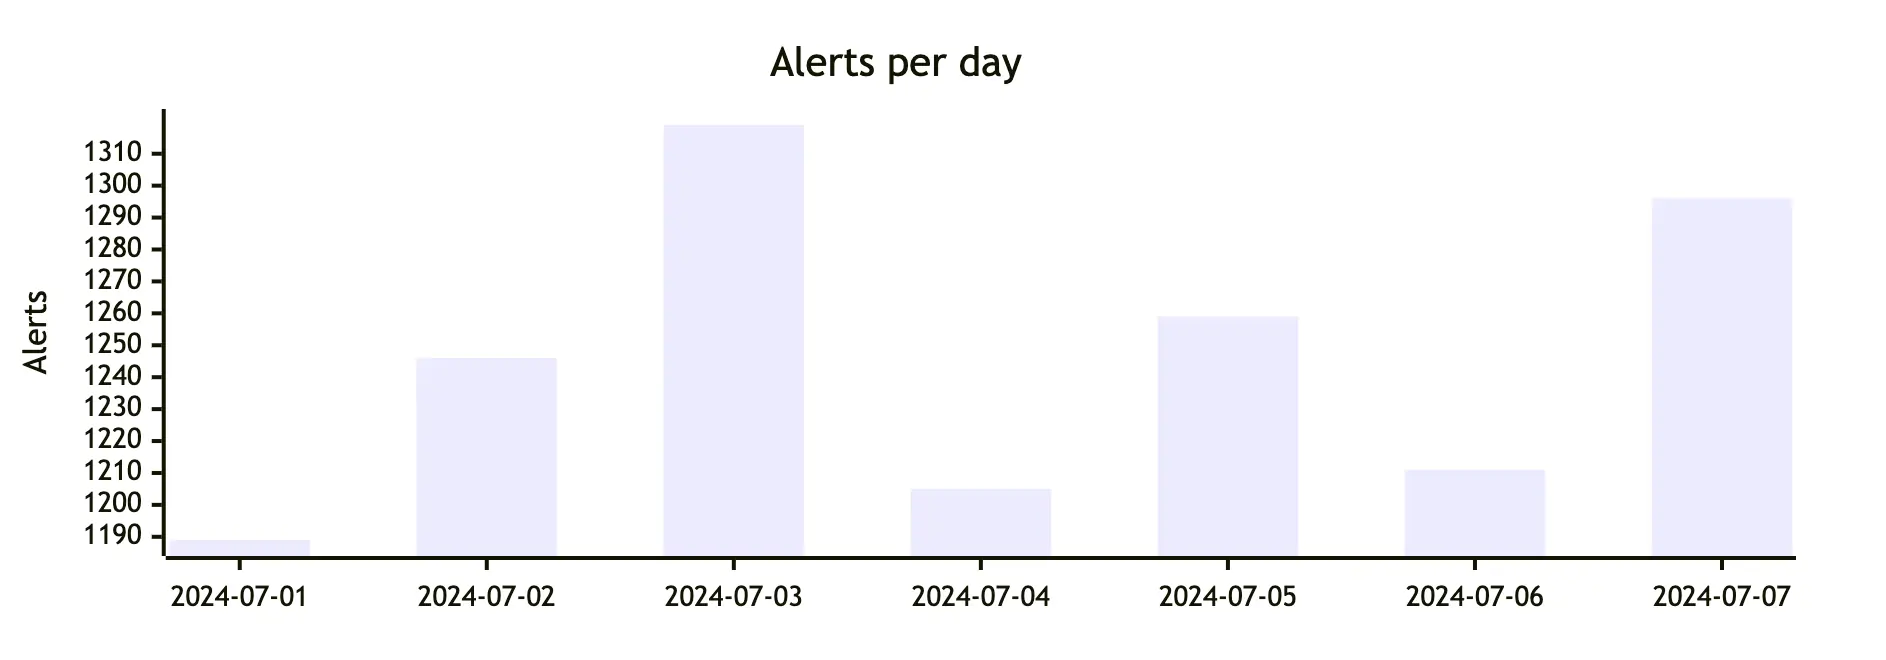
We may hypothesize that an increase in alerts and an analyst calling out sick will more than likely negatively impact the number of SLA breaches, but the data included in this section allows us to test that hypothesis.
# Analyst shifts for the week.
# Shift pattern is 12h shifts, 2 days on / 2 days off, 2 people per shift
# The shift boundaries are in the format of "%a, %H:%M"*
analyst_shifts = {
  # ...
  "Steve Acosta": [
    ["Mon, 12:00", "Mon, 23:59"],
    ["Tue, 12:00", "Tue, 23:59"],
    # Steve was sick on Fri and Sat
    # ["Fri, 12:00", "Fri, 23:59"],
    # ["Sat, 12:00", "Sat, 23:59"],*
  ]
  # ...
}
Being an analyst down may affect SOC SLAs, but this will depend highly on the measurement period, so it’s best to use proportional measures that are context-aware. We use an average number of alerts per hour per analyst, accounting for the number of analysts on duty and the volume of alerts they face. This quantifies the otherwise qualitative condition of being low on personnel.
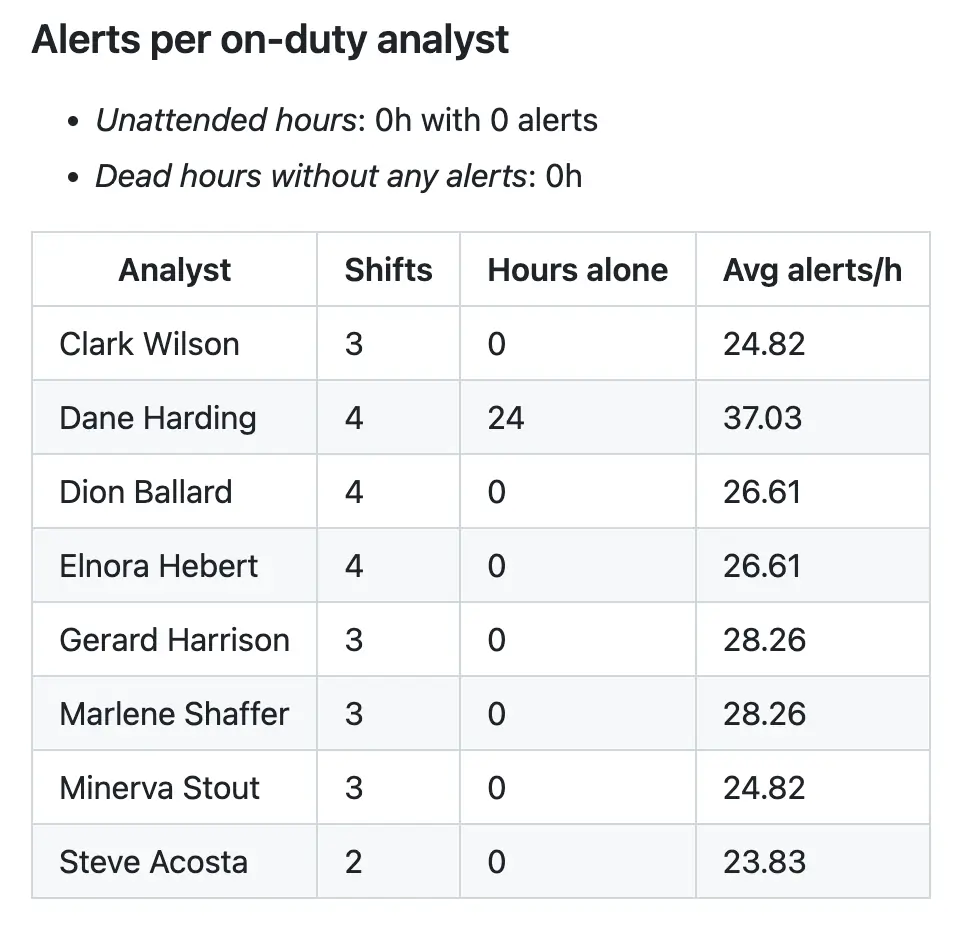
It’s important to track these metrics — the values can be used for meta-analysis, helping identify patterns that lead to SOC performance degradation. Moreover, these metrics can complement other data points (such as results of employee engagement surveys) and used to track how workload affects employees’ engagement, satisfaction, and retention rates.
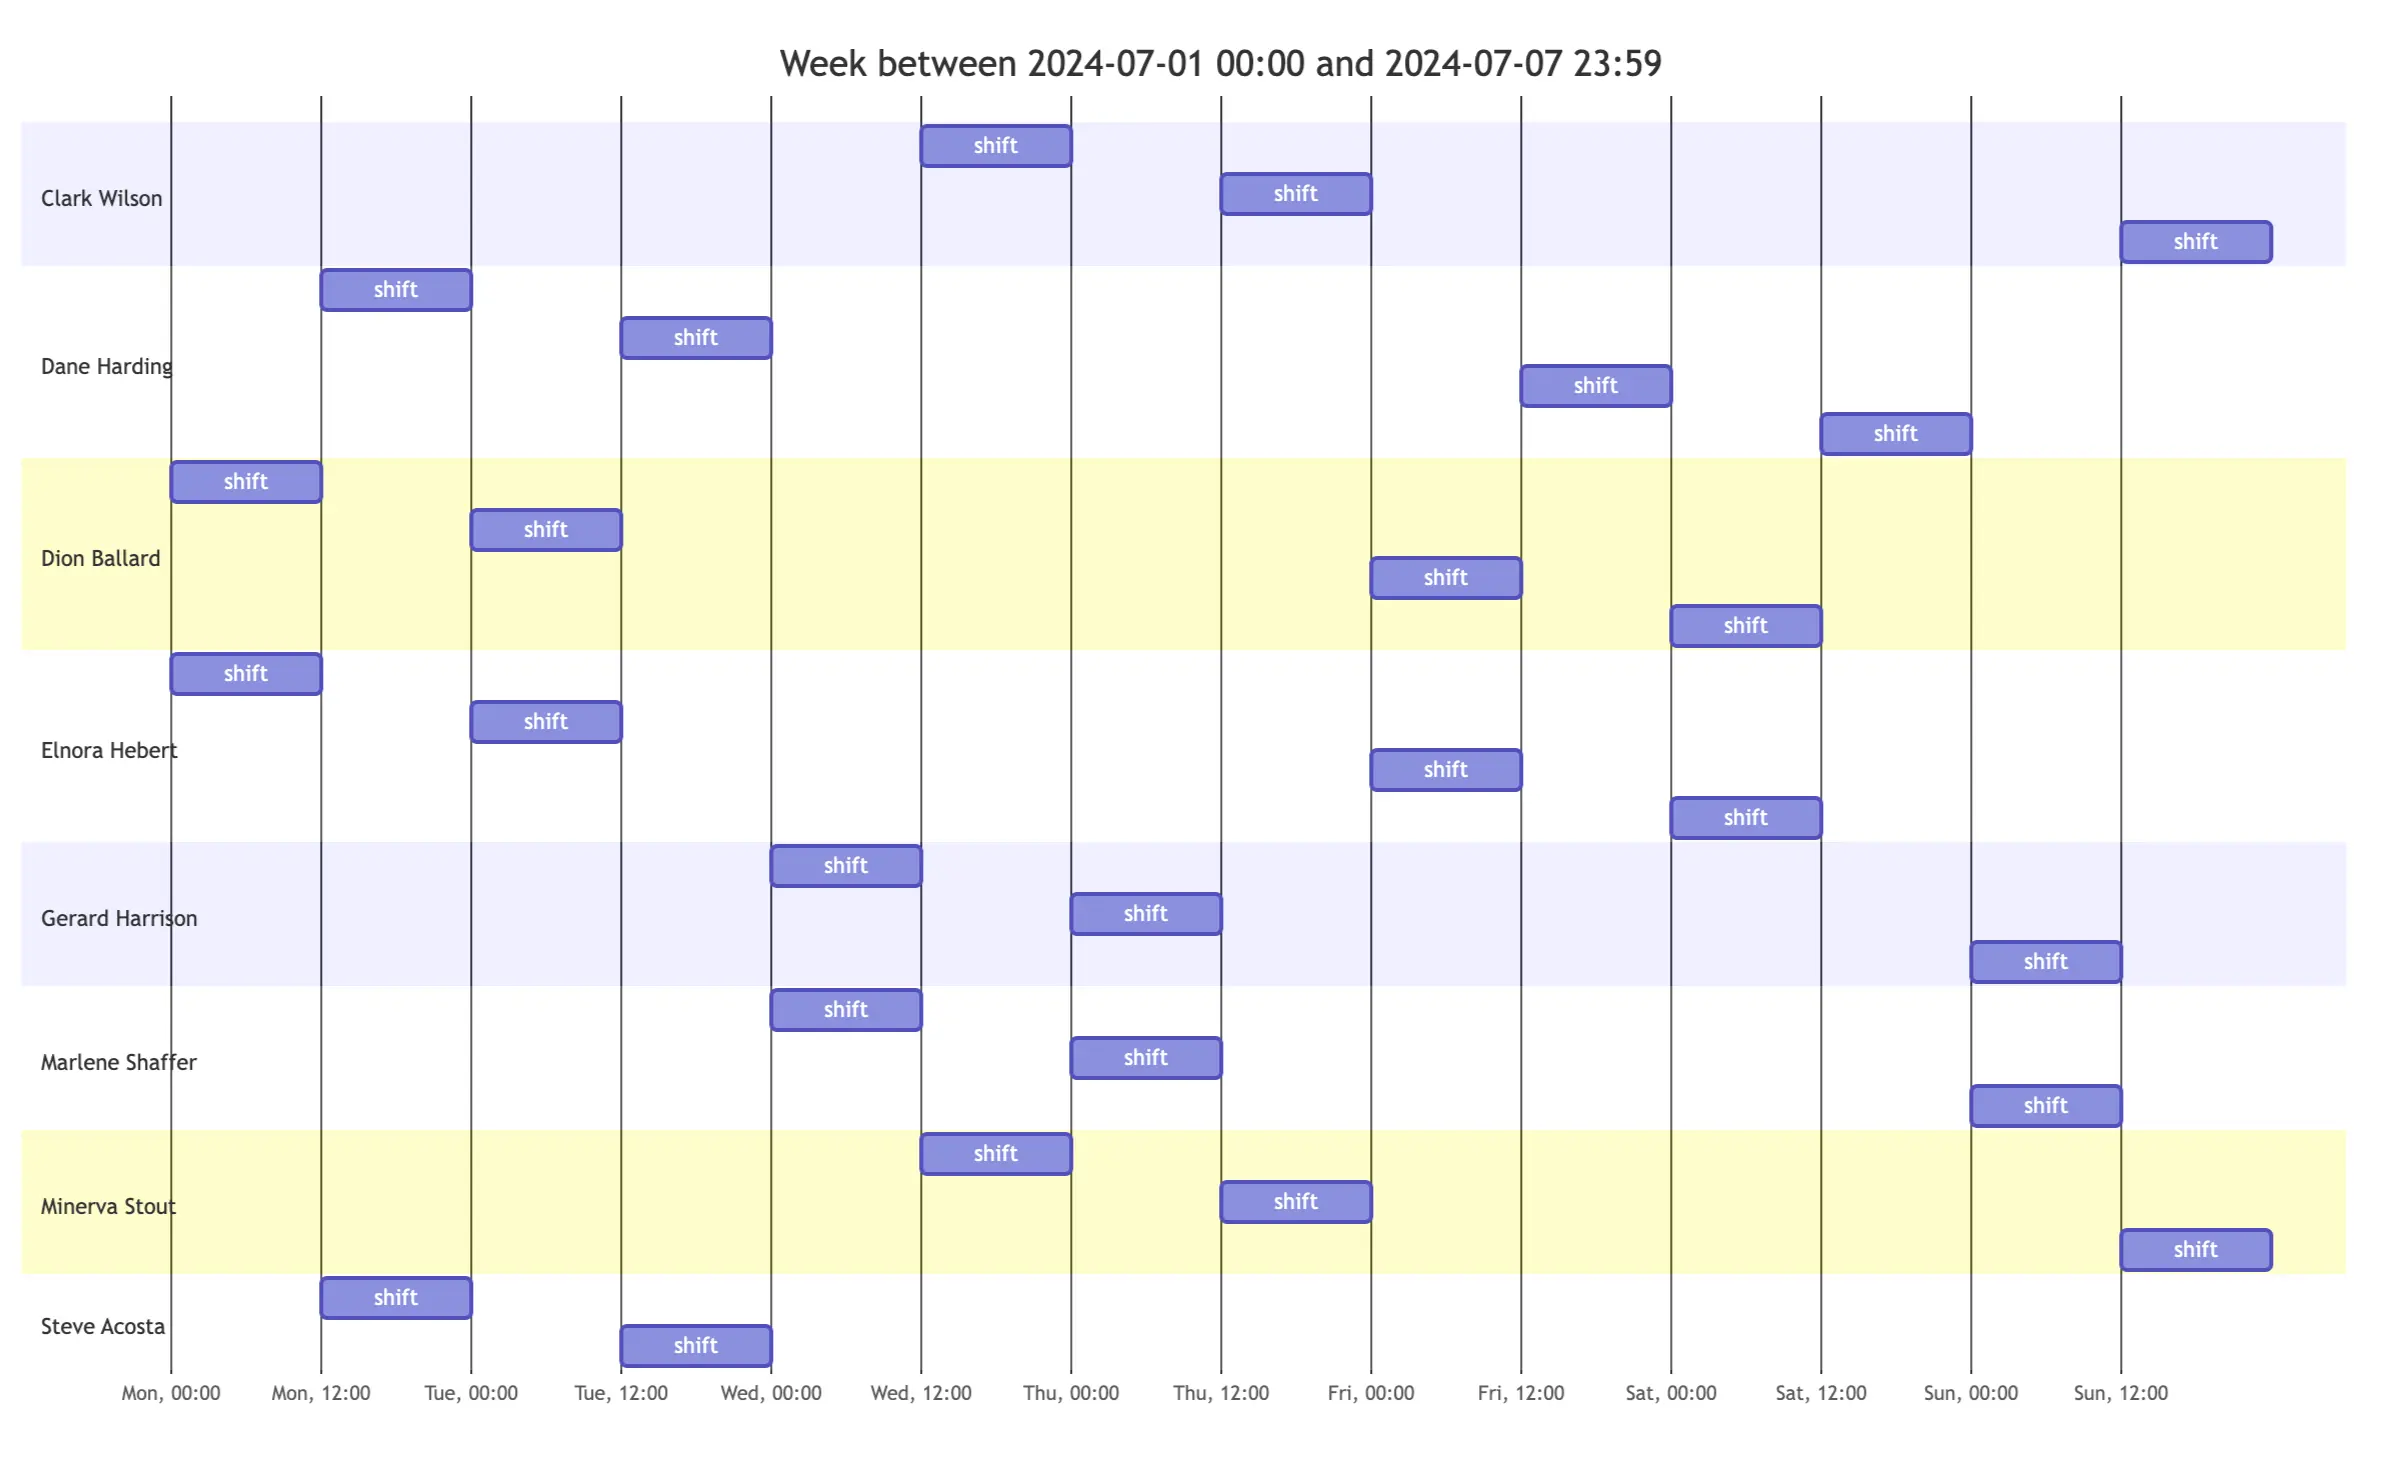
In this section, in addition to the table block, we use code blocks for MermaidJS charts — the alerts-per-day bar chart and an analyst shifts chart. We’re rendering the template as Markdown, so having GitHub rendering charts is very useful.
For example, the alerts-per-day chart is defined as code block and relies on aggregations from data.elasticsearch.alerts_curr:
content code {
  language = "mermaid"

  value = <<-EOT
    ---
    config:
        xyChart:
            width: 900
            height: 300
            xAxis:
                labelPadding: 5
            yAxis:
                titlePadding: 10
    ---
    xychart-beta
        title "Alerts per day"
        x-axis [
          {{- $divider := "" -}}
          {{- range .data.elasticsearch.alerts_curr.aggregations.per_day.buckets -}}
            {{ $divider }} {{ substr 0 10 .key_as_string }} {{- $divider = "," -}}
          {{- end -}}
        ]
        y-axis "Alerts"
        bar [
          {{- $divider := "" -}}
          {{- range .data.elasticsearch.alerts_curr.aggregations.per_day.buckets -}}
            {{ $divider }} {{ .doc_count }} {{- $divider = "," -}}
          {{- end -}}
        ]
  EOT
}
Out of scope #
In this blog post, we discussed SOC metrics useful in operational reporting and built a template for SOC weekly activity overview report, using Elastic Security solution as a primary data source.
We didn’t touch on many important topics: building a feedback loop with stakeholders (how do we determine which insights are valuable and which require clarification?), evolution and maintenance of the templates (how can GitOps and CI/CD practices help us improve the timeliness and the quality of reporting?), capturing and maintaining a paper trail for auditors, and more. We hope to return to these topics in the following posts.
Do better #
The template we built contains the core metrics essential for assessing SOC performance. However, it must be adjusted to fit the needs and specific environment of an organization.
It’s important to remember that as a community, we can’t improve what we don’t measure, and we can’t work together if we don’t communicate. Tracking and sharing operational metrics leads to better SOC performance; clear and consistent reporting leads to better situational awareness for stakeholders.
Be mindful of what you track and how you track it. Get feedback from your team and stakeholders to ensure the metrics and reports are useful and clear. Embrace automation — it’s 2024, the computers excel at saving time and producing consistent quality content! By reducing the operational load on the analysts, we can positively impact security practice and improve practitioners’ lives.
Want to see Fabric in action? Request a demo for your team!
And stay tuned for more content!
References #
- “SOC Weekly Activity Overview” template
- “SOC Weekly Activity Overview” report example rendered as a Markdown document
 "Pets vs Cattle"; Photo by
  "A landscape of security solutions"; Photo by